Out-of-the Box Analytics Ready to Connect to Your ERP Data
Experience the real benefits of our solutions
- Quality analytics that answer 90% or more of questions/issues that arise
- Data in the format you want it to support data-driven decisions
- Uncovers insights otherwise never known
- Automation to save time
Our Analytics
Performance. Growth. Profit.
The impact our solutions can have on your business.
Impact Analytics has several out-of-the box solutions that deliver the analytics and insight your organization needs to measure and monitor performance, growth, and profit in core areas such as sales, marketing, customer service, operations, and finance.
Our solutions are configurable and can be deployed in weeks, not months. And, because we have experience working with many ERP Systems, like Microsoft Business Central / Navision, Sage, Epicor, and many others, we know how to efficiently extract your data so we can make it come alive with our analytics.
Our Results
By utilizing our solutions, you’ll see instant results in the following areas.
Sales & Marketing
- Automated sales reporting
- Develop accurate sales goals
- Monitoring sales performance to goals
- Measuring short and long-term sales growth
- Grow sales
- Dynamic leaderboards
Finance
- Automated financial reporting
- Increase profits
- Reduce DSO & improve A/R collections
- Monitoring A/P Payments
- Develop operating budgets
- Manage department expenses
Customer Service
- Meet customer delivery expectations
- Tracking customer loyalty
- Understand customer value & behavior
- Understand customer buying patterns
- Monitoring customer discounts and returns
Operations
- Manage material demand
- Reduce stock-outs
- Achieve just-in-time inventory
- Improve inventory turns
- Improve vendor on-time performance
Our Work
Explore some of the business-critical questions Impact Analytics can help answer.
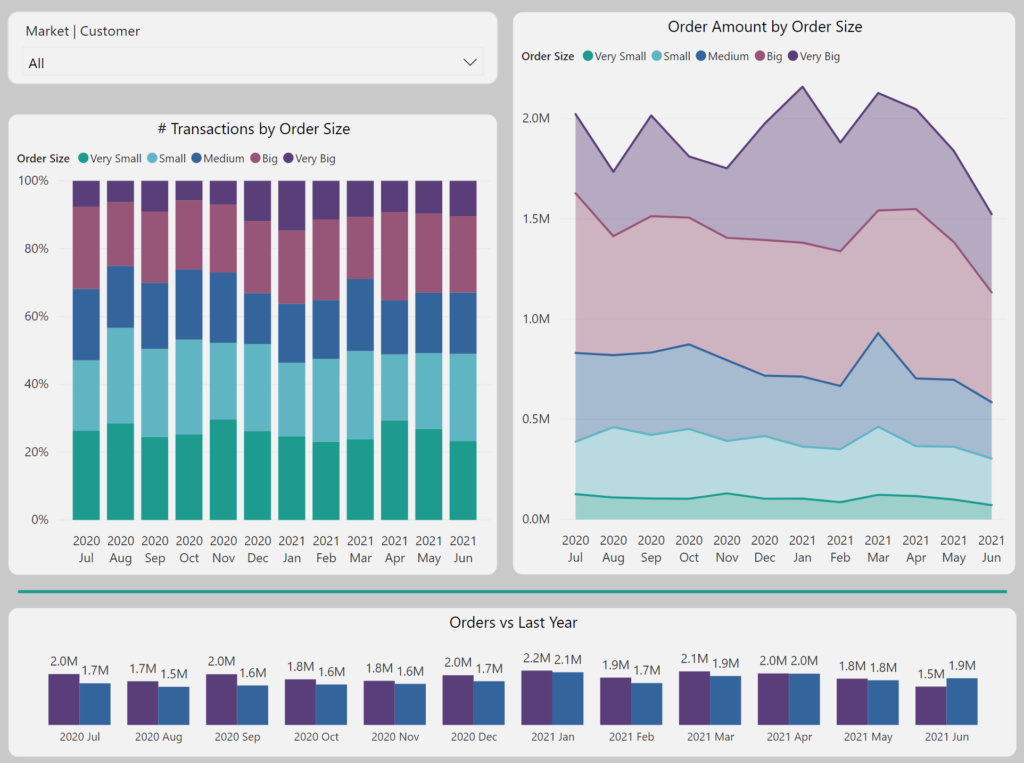
Is customer order size shrinking or expanding? What impact does this have on your operations?
- Analyze number of transactions and order amount per order size
- Real-time visualizations to determine growth or shrinkage
- Month over month changes compared to last year orders
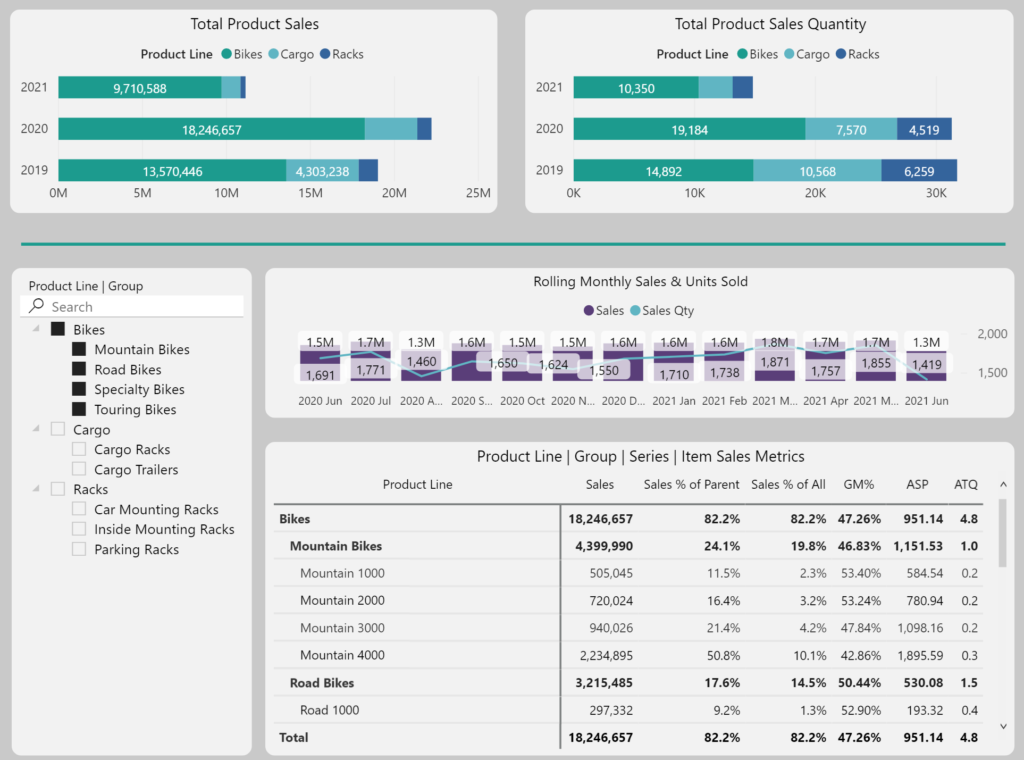
How has the mix of your business changed overtime?
- Compare product group sales and quantity year over year
- Responsive layout to switch between product groups
- Percent mix of product group sales compared to all company sales
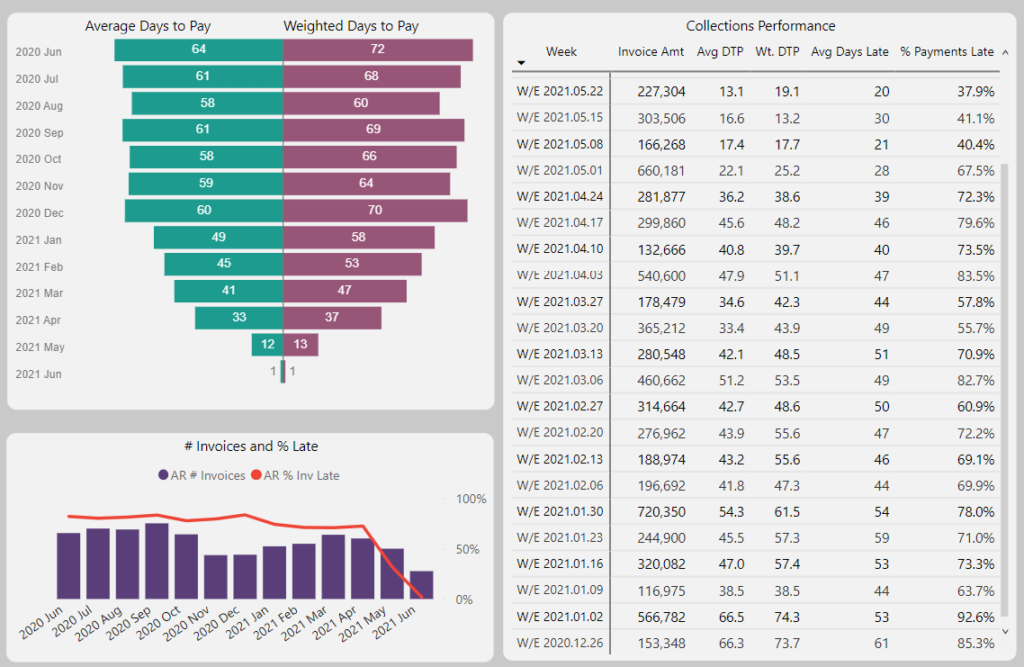
Do you have accounts receivable collections issues?
- Track how long it takes customers to pay you
- Know what percent of invoices are paid on-time vs. paid-late and how many days late
- Understand which customers consistently pay late
- Monitor collections to see if problem-areas are improving
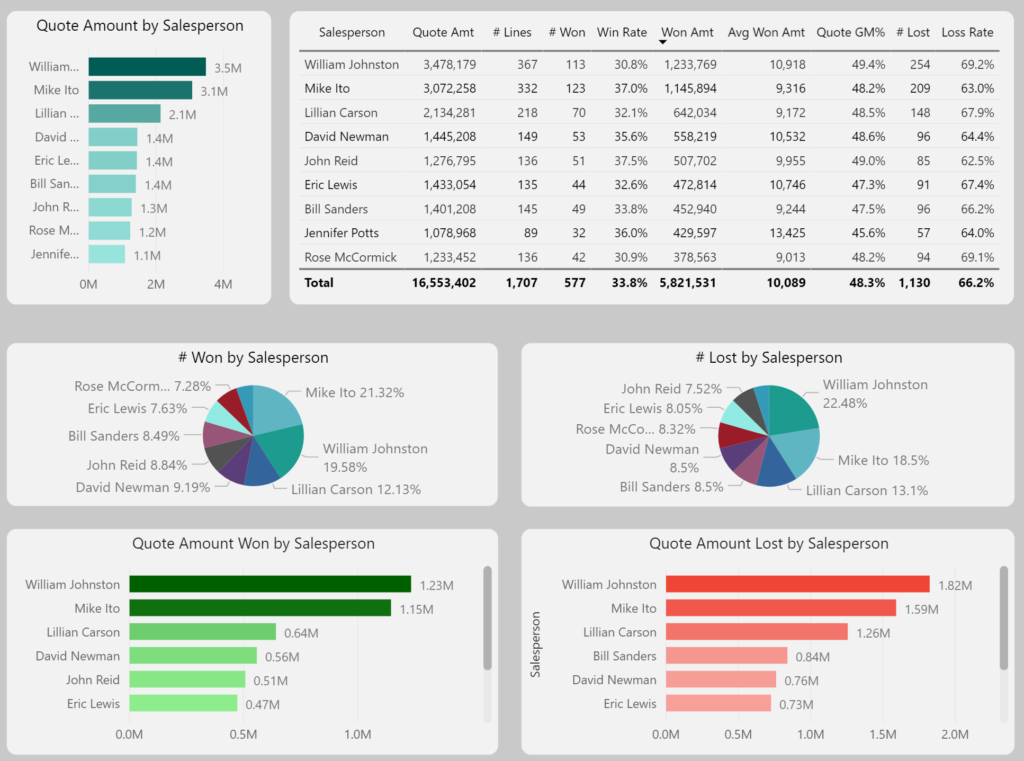
How is your sales team performing at converting quotes into orders?
- Monitor percent of quotes won by salesperson
- Track number of quotes and monetary value of quotes won vs. those lost
- Know how long it takes for a quote to be turned into an order
- Understand where the most opportunities have been won (for example, channel, market, new vs. repeat)
To see more, fill out our contact form and we’ll be in touch.